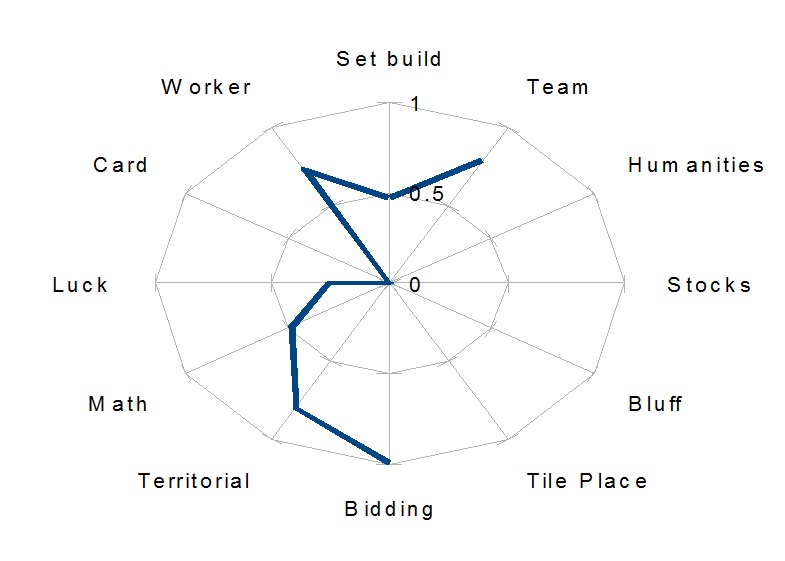
The categories are:
Set Building, Worker Placement, Card Management, Luck, Mathematics, Territorial Control, Bidding, Tile Placement, Bluffing, Stock Manipulation, Humanities and Team Performance.
These are all fairly obvious, except for “Humanities” which is a rare category which requires the gamer to have some knowledge of scholastic subjects like Art, Literature, Writing etc. For example, Dixit and Timeline.
If it all seems confusing, I hope a few graphs will smooth things over. We’ll start with the current leader of the division and work our way down. This is how it looks a t the moment.
And remember: this is just about our performance this season...
Martin does well in all games, so it seems, but he seems to do worse in games that involve Set Building and Stock Manipulation. But this could be because we daren’t play Palaces Of Cararra on a games night. On the plus side, as you might expect for a man who can glance at a game of Take It Easy and tell you who’s won, his strength is Mathematics. And he’s pretty lucky too, which makes it all the more infuriating!
 |
| Martin |
Like Martin, Sam does well in games of Luck and Mathematics. Surprisingly, given his love of and skill at Tinners’ Trail, he’s done badly in Worker Placement and Bidding games this year. (By the way, Sam has played no team games this season, hence the break in his graph.)
 |
| Sam |
Next is me. I’m terrible at Tile Placement and Worker Placement, but make up for it with my bluffing skills. Clearly, my habit of giggling whether I have a good or a bad hand is paying dividends.
 |
| Andrew |
Fourth in The Division at the moment is Adam. Can it be coincidence that the top four places on the Division are held by people with plenty of luck? It’s been an odd season for Adam so far. He can rely on his mathematical prowess, bidding skills and sheer good fortune, but little else this year.
 |
| Adam |
Fifth is Joe. He has a fairly well-rounded graph, showing skills in Worker Placement, Tile Placement, Card Management and a whole host of board gaming skills. But, as he will no doubt agree, he’s had no luck at all.
 |
| Joe |
Sixth comes Gonz. Another graph that shows decent across-the-board ability, especially in territorial games. However, Gonz falls down when it comes to Mathematics.
 |
| Gonz |
In seventh place comes Chris, the leader of the Bracknell Bunch. Fiercely territorial but has very little luck. And I thought all that pessimism was just his personality. Turns out he might have a point!
 |
| Chris |
Paul scores well in Set Building, Card Management (so that’s why he’s good at Alhambra) but does badly with Mathematics and Territories (so that’s why he never became a cartographer).
 |
| Paul |
Steve’s graph is the prettiest, since it looks like a ribbon tied in a knot. Although Steve hasn’t played any games with Tiles, Stocks or Humanities, he does well in four important categories: Set Building, Worker Placement, Card Management and Luck, which explains why he has such a large lead in Points Ratio.
 |
| Steve |
In tenth place is Hannah. Her graph show ability across the board, apart from that all important Luck factor.
 |
| Hannah |
James is next. He might be the luckiest of the Bracknell Bunch (or “The Brunch” as I might start calling them) but he’s still in third this season.
 |
| James |
Anja has played the fewest games, which is why her graph looks half-finished. No surprises that she’s very territorial (Wallenstein, anyone?) but her strength this year has been in Bidding games. But not lucky, and bad with Card Management. Stay away from the Poker tables, Anja.
 |
| Anja |
Newcomer Matt’s graph is a bit splintered, but he’s already showing promise in Mathematics and Bidding.
 |
| Matt |
Lastly is Will, who’s only played two games, which isn’t enough to put a graph together. Hopefully he’ll join us more often when he realises he may be immortalised in a spreadsheet somewhere.
And that's all for now. I hope you find the graphs interesting. And framed prints are available at a very reasonable price!


Amazing! Gonz' graph looks like a happy monitor
ReplyDeleteWow! These are great Andrew!
ReplyDeleteWhich games make up each category? Is it one category per game or do some games count towards more than one?
I'm blaming my poor form this season on playing too much Kingdom Builder with Martin and Gonz...
Each game contributes to more than one category. There's a bit of subjective judgement as to how I've done that, but I've tried to be accurate. For example, Take It Easy is 50% Maths and 50% Luck, whereas Biblios is 20% Card management, 20% Luck, 10% Maths, 30% Bidding and 20% Bluffing.
ReplyDeleteOf course, there's an element of luck in all games, but if it's not a major aspect, then I've not used it as a category for that game (e.g., Village or Caverna).
Vindicated at last!
ReplyDeleteGreat stuff. :)
This is brilliant Andrew!
ReplyDelete